Carbon Intensity Forecast Tracking
Electricity in the UK is supplied by a mix of different generation sources. Renewables like wind and solar produce no carbon dioxide at the point of generation, are dropping in price, and increasingly supply a large proportion of our power. But with their current limited capacity (we just haven’t built enough yet), we’re still quite dependent upon fossil fuels.
The UK’s National Grid Energy System Operator (NGESO) publishes half-hourly estimates of consumed electricity’s carbon intensity (CI), in grams of CO2 per kilowatt-hour. They combine live electricity consumption and generation data with figures about the relative CI of different generation sources, from a paper by Iain Staffell (2017).
One purpose is to help people decide when best to use electricity, based upon the greenness of the grid. If you use appliances or charge batteries when renewables are supplying much of the electricity to the overall mix, you can reduce your personal carbon emissions.
Predicting tomorrow’s carbon intensity
They also provide a forecast, which predicts half-hourly national (and regional) CI up to 48 hours in advance.
This is republished in various third-party apps. You might plan to, say, charge your car when the forecast predicts a low CI spell overnight.
But how reliable are those forecasts?
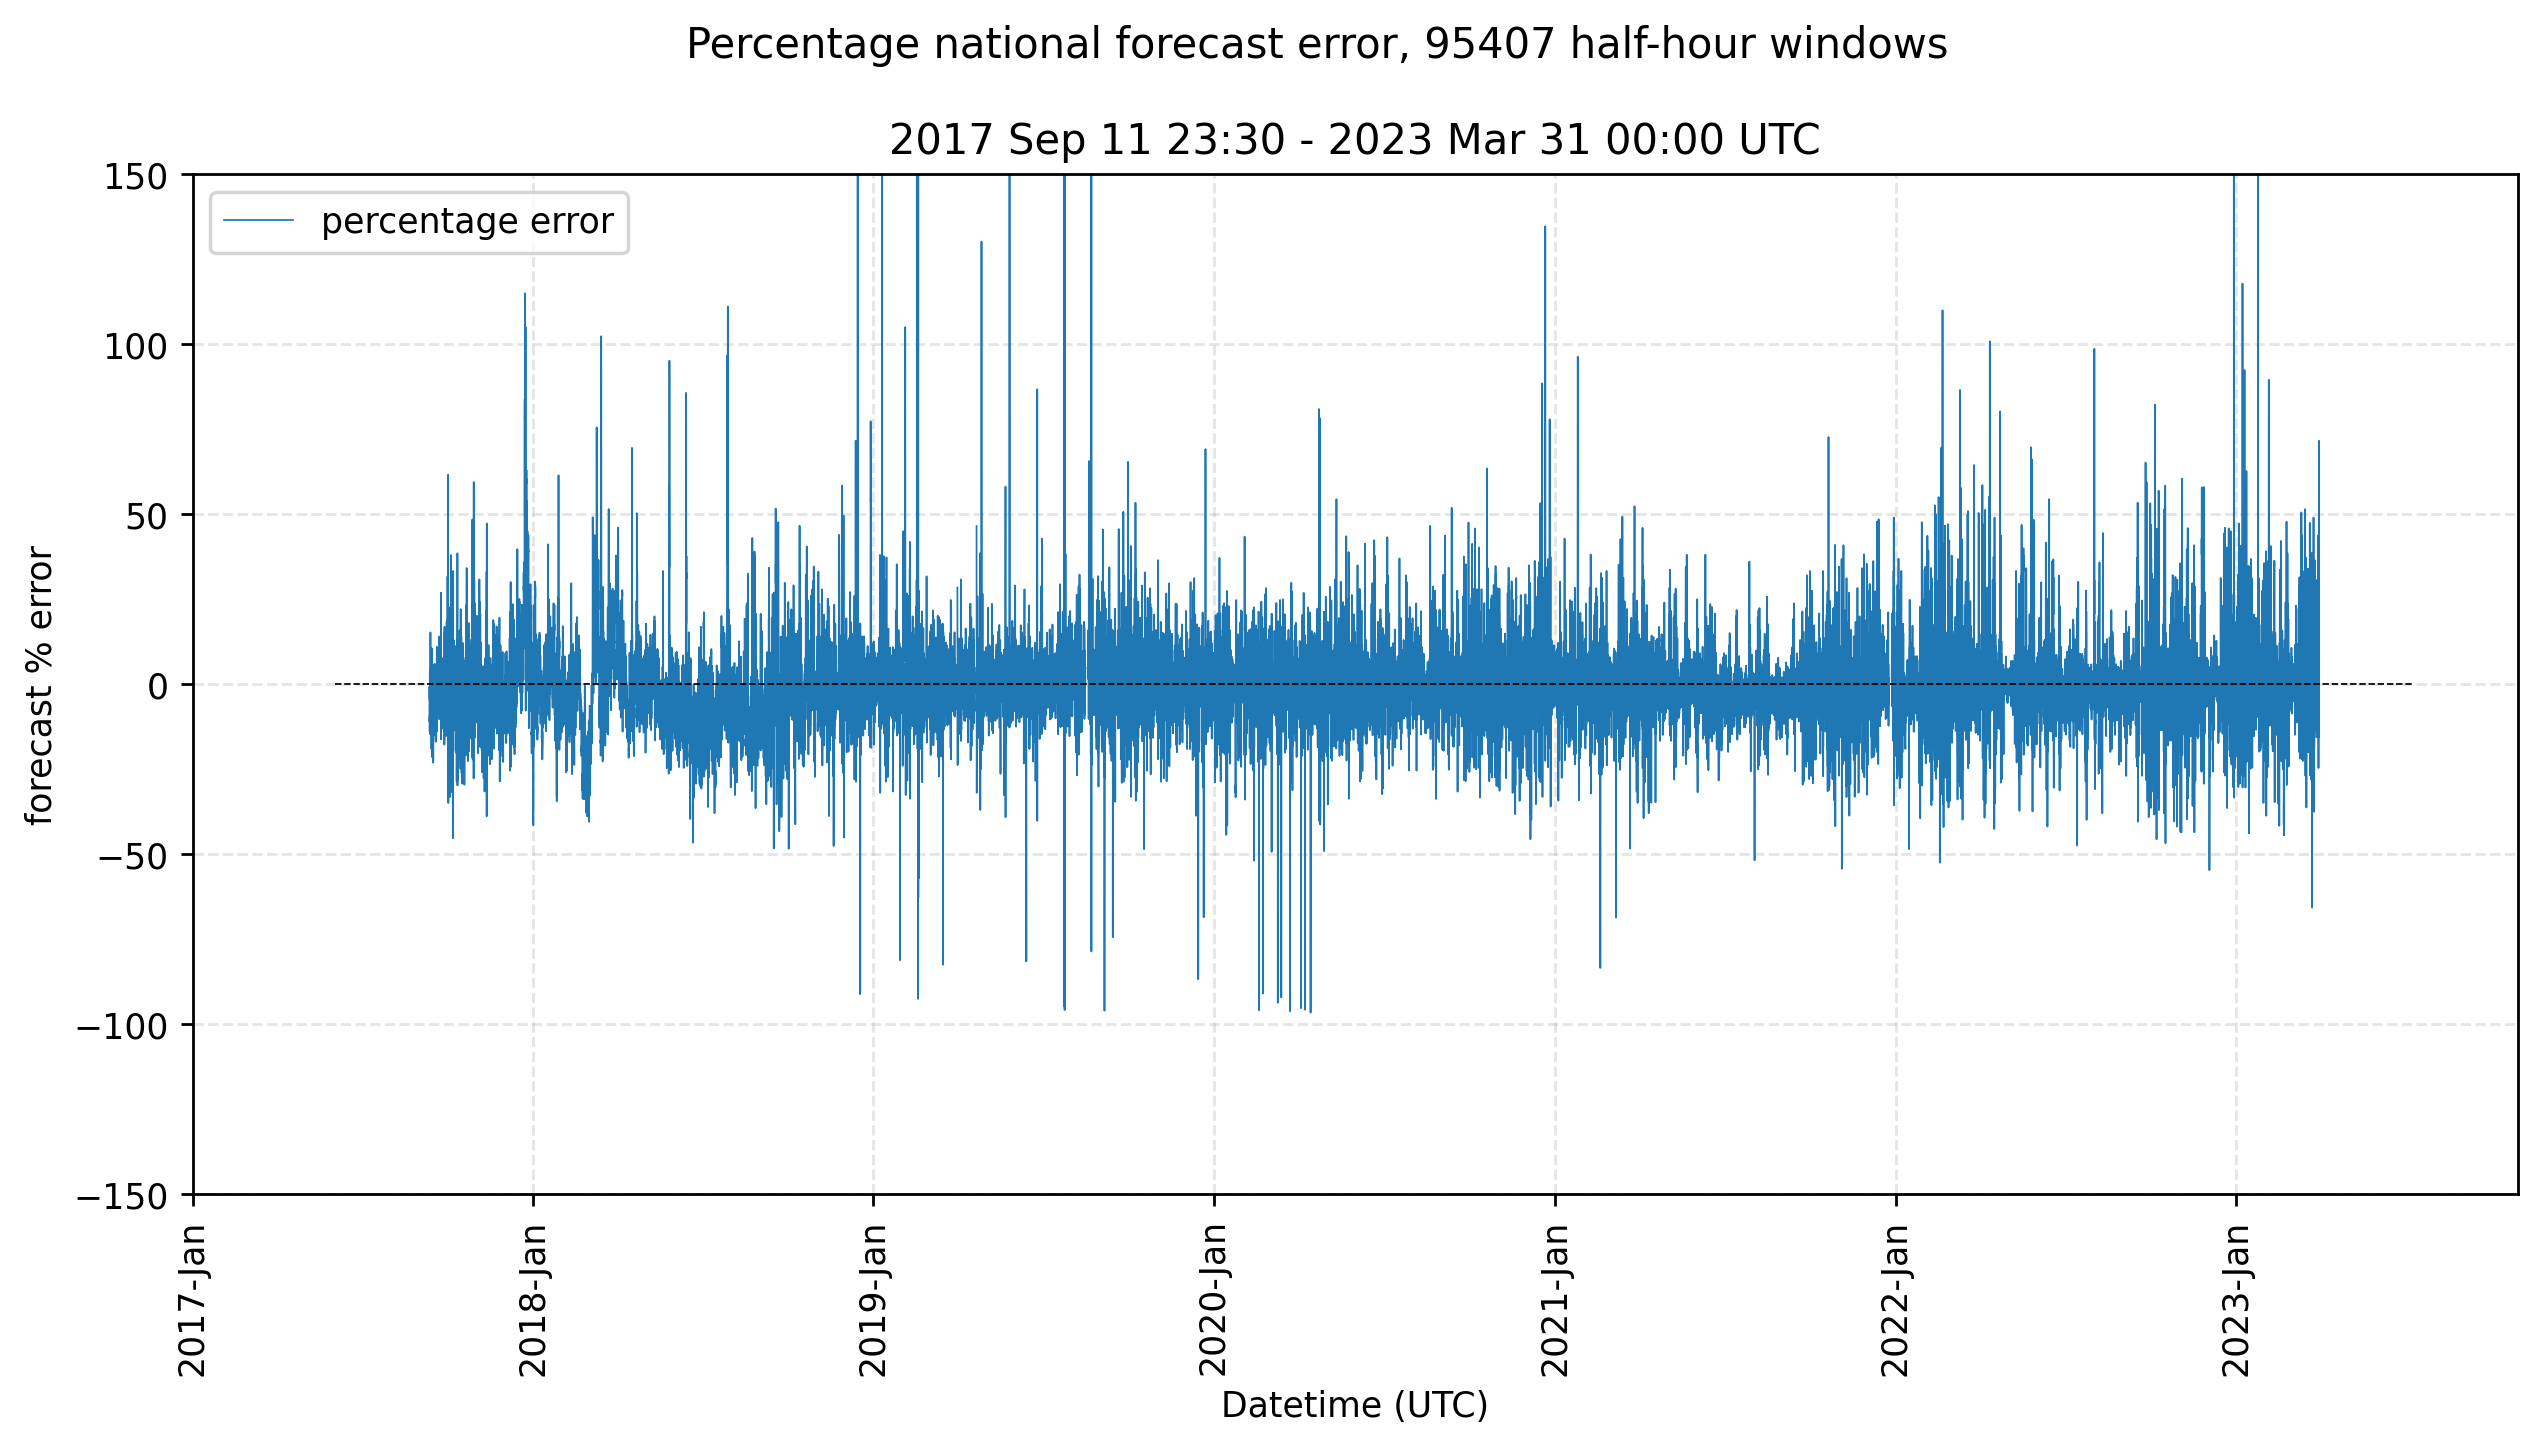
At the Carbon Intensity API site, “actual” and “forecast” values are compared on a graph, and you can download historical data1. Here’s a plot of the forecast percentage error ($100\times(forecast-actual)/actual$) from that data from September 2017 until March 2023. The mean absolute error was 13.7 $gCO_2/kWh$ (standard deviation 72.6 $gCO_2/kWh$); the mean absolute percentage error was about 7.1% (s.d. 29%). The overall error range was much greater, from -96.6% to 4366.8% (there were some huge overestimations in 2019).
At the time, each of those forecasts was updated every half hour, for 48 hours, overwriting old forecasts for the same future half-hour time window. The old forecasts are not kept, so the above graph reflects the final forecast given for each window.
Forecast quality
How good are the individual forecasts up to 48 hours in advance - the ones you see when you check the apps? Can we confidently rely upon a forecast at any given time?
I asked some of the creators of the API, and it seems they don’t measure (or at least don’t release) forecast quality. So I’ve made a small git scraping project to capture the forecasts as they are published, and then compare them with the “actual” values for each window. Here are some results.
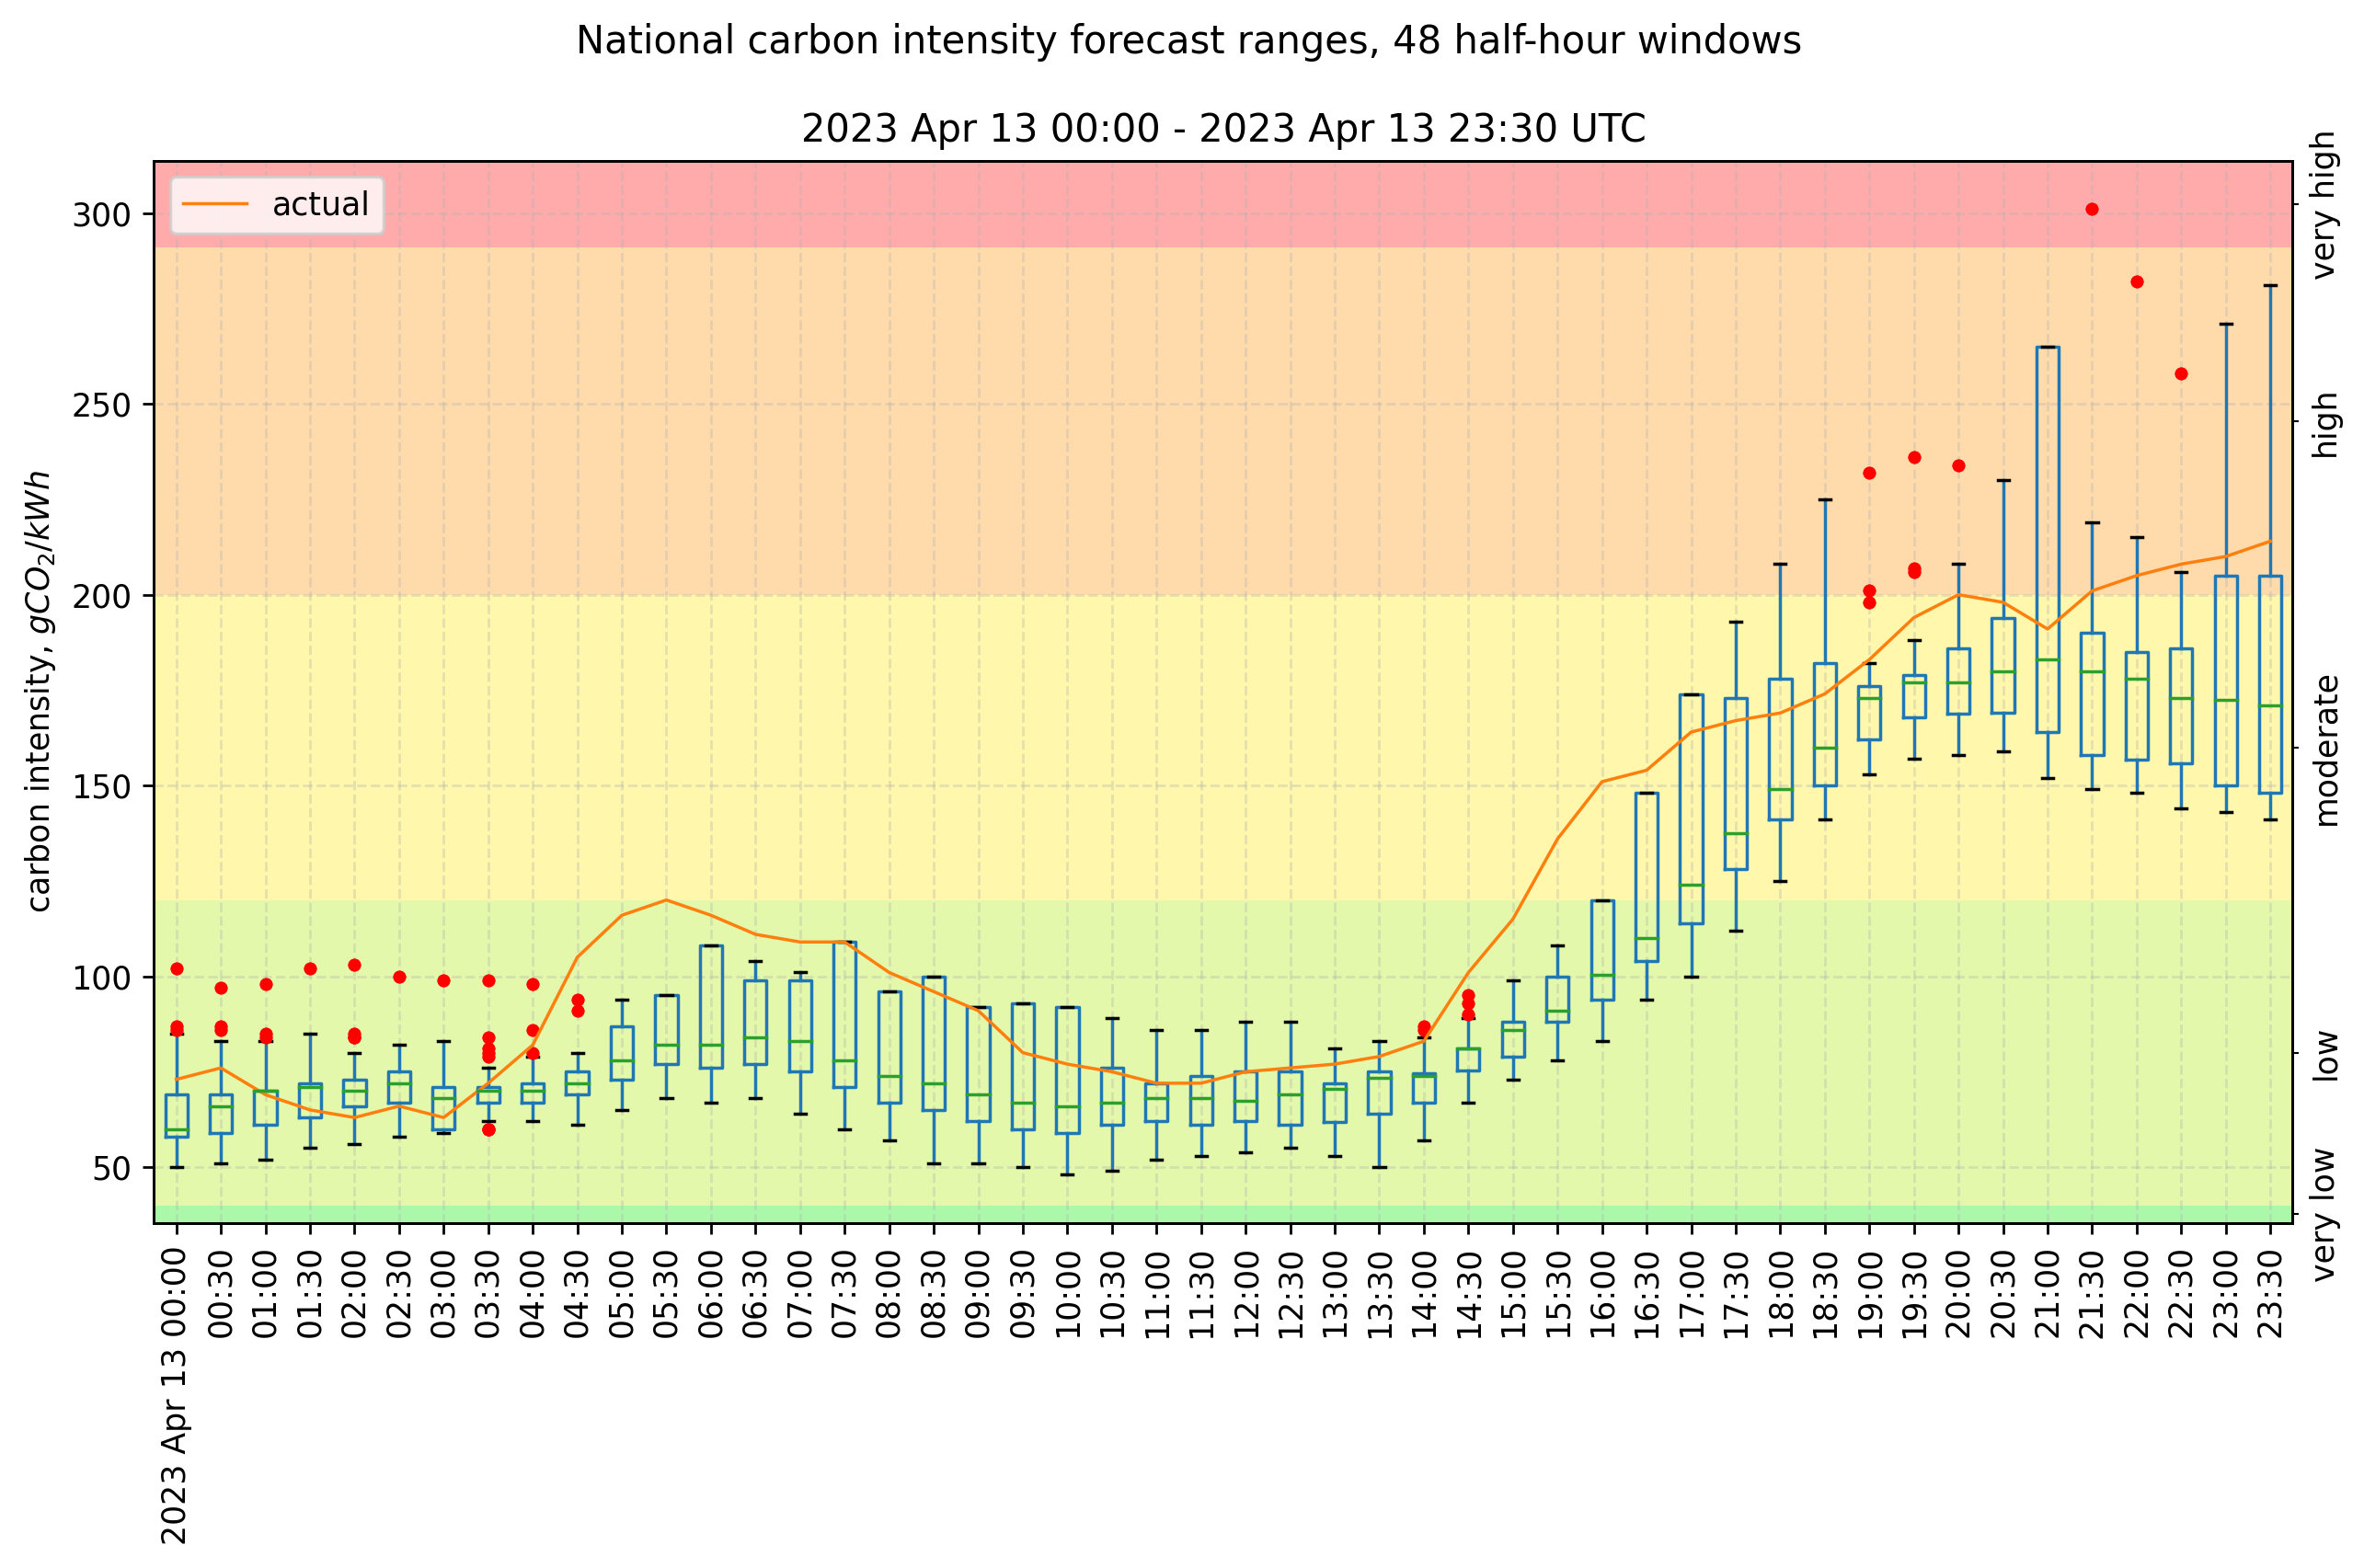
This plot shows the evolution of forecasts for a single time window. There are about 96 forecasts (ignoring missing data), one every half hour, for 48 hours before each window. I’ve also recorded values for 24 hours after the window has passed, because the “actual” value (in orange, here) is sometimes updated. Note that the final (rightmost) forecast, which is fairly close to the “actual” value, doesn’t capture the range of earlier forecasts, illustrated by a boxplot.
We can show the range of forecast values for every half-hour window in a day using more boxplots. The above plot shows this for the same day, 13th April 2023. The colour bands represent the qualitative CI “index”. This index (“very low”, “low”, “moderate”, “high”, “very high”), from green to red, has distinct bands (from the methodology paper released by NGESO) and these are often cited in 3rd-party apps. They are updated annually to 2030, narrowing each band to reflect increasingly stringent CO2 emissions targets.
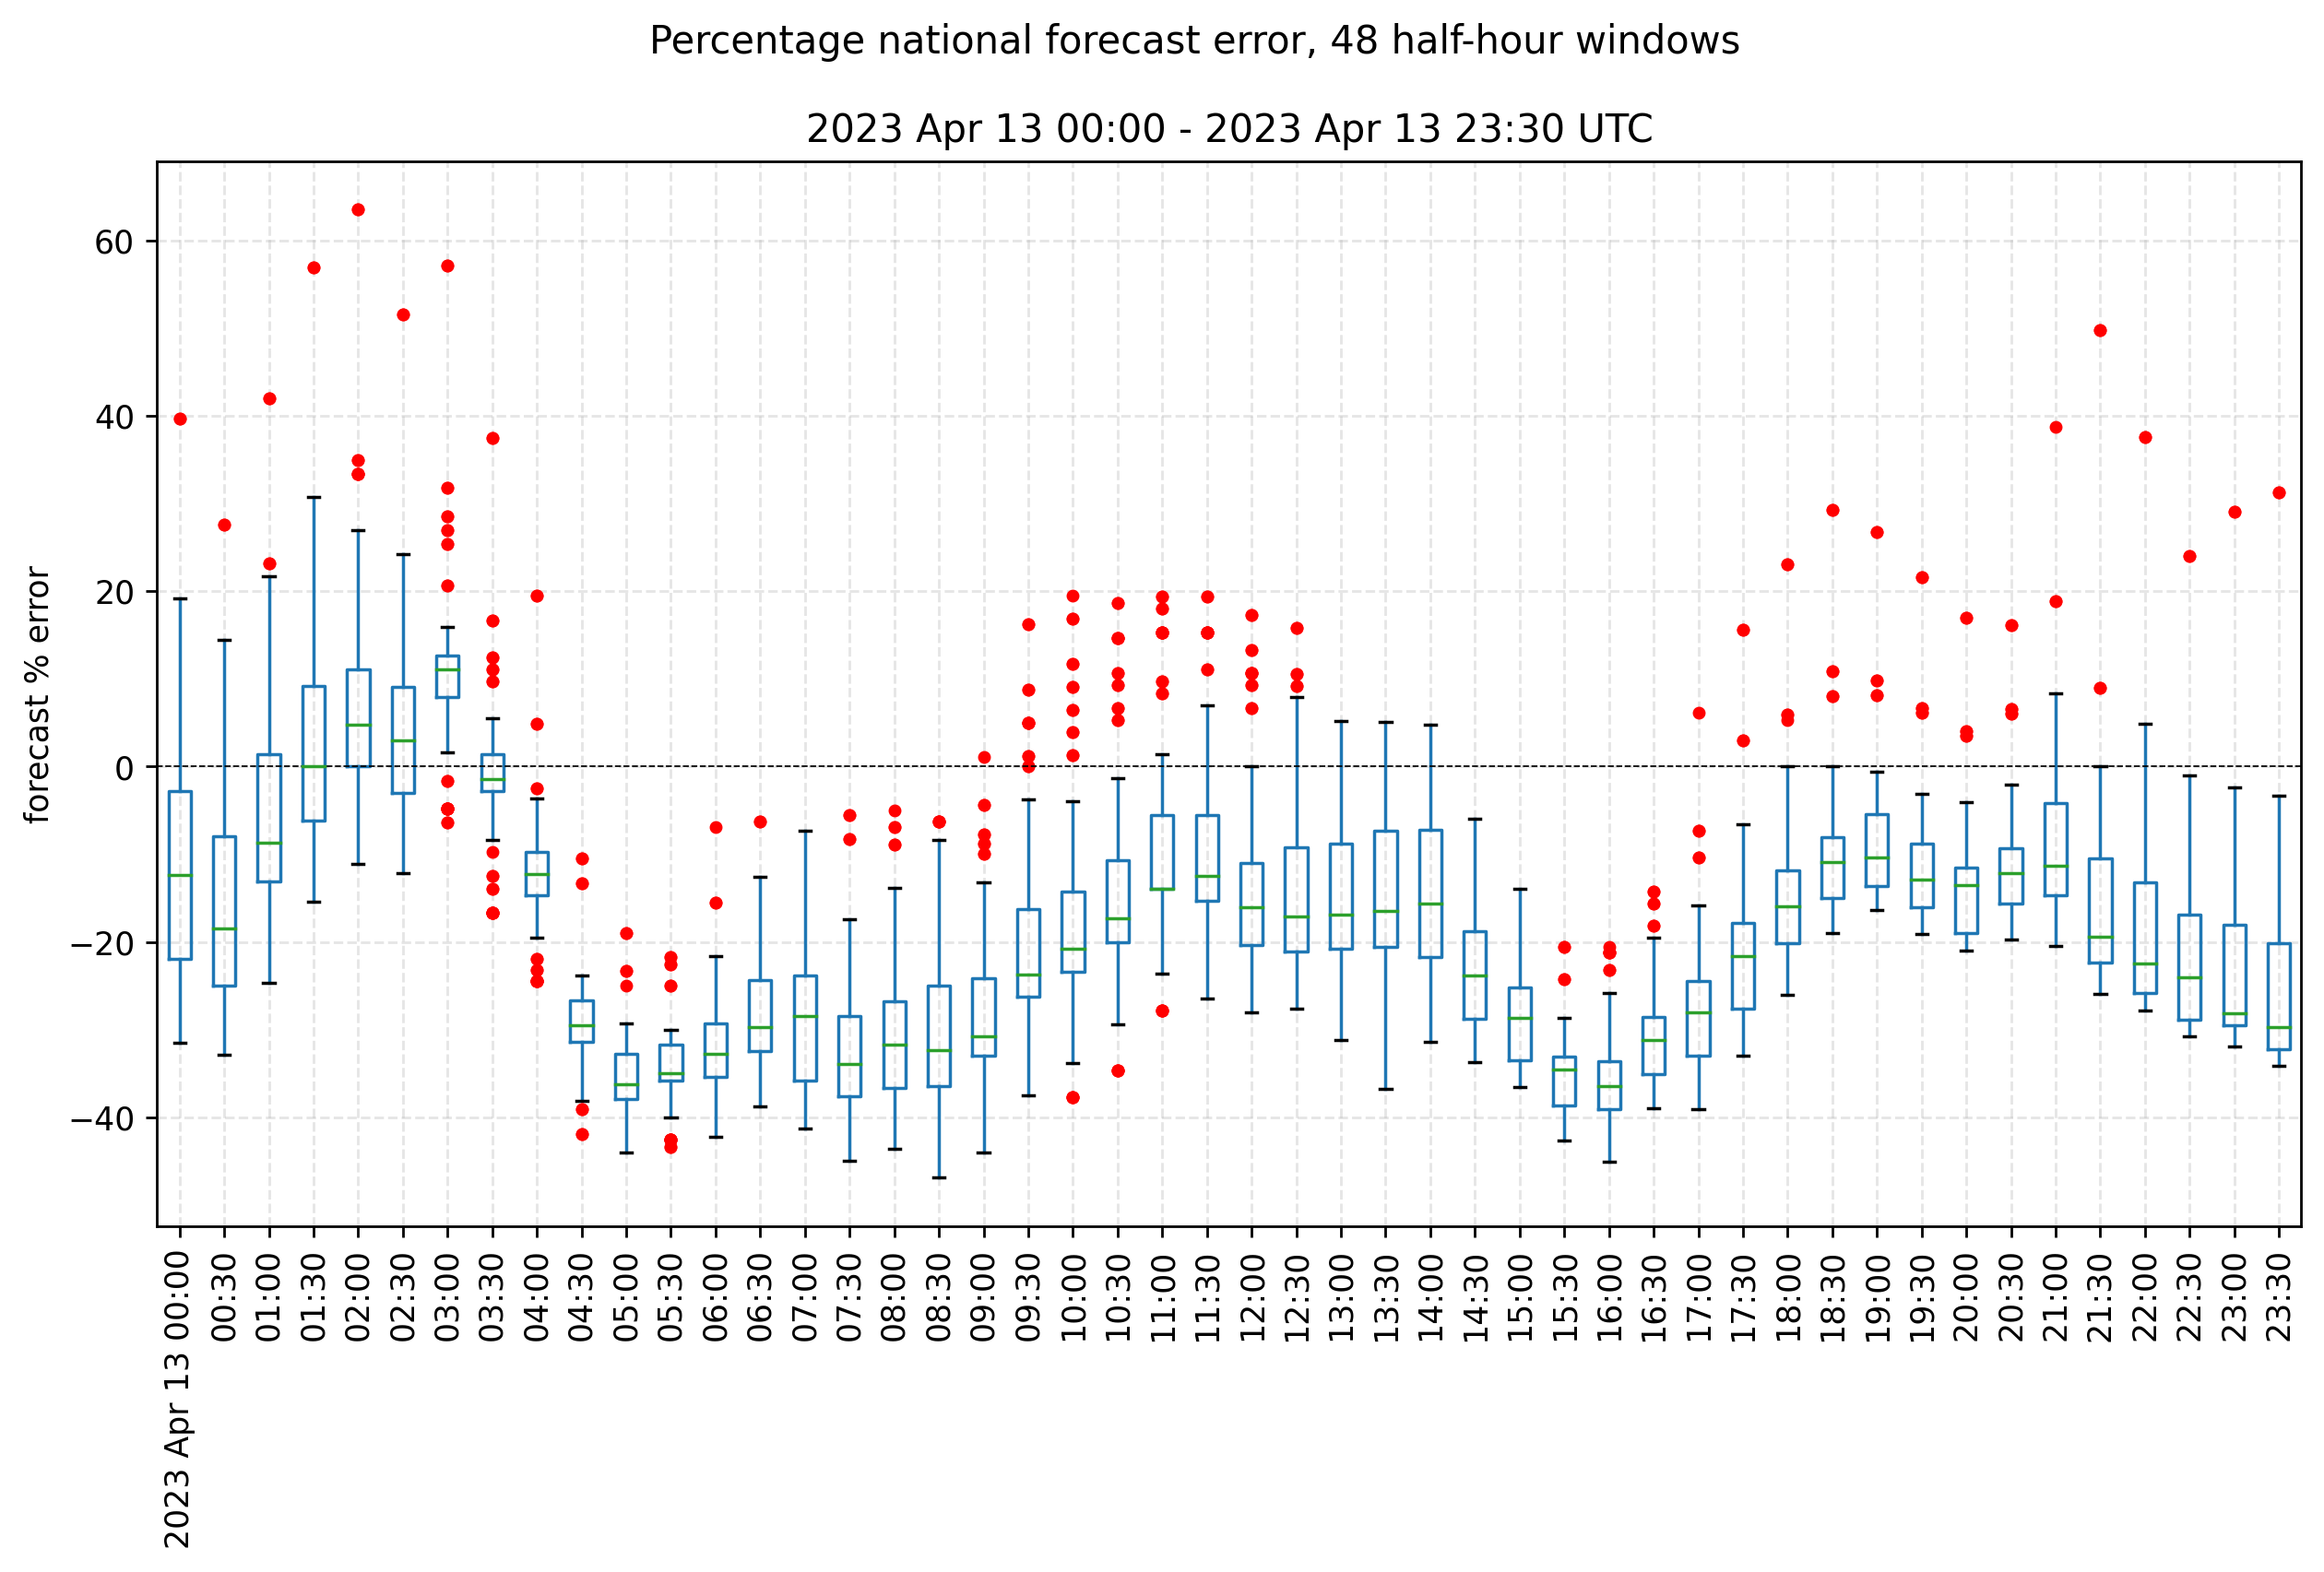
Given the “actual” value, which is recorded shortly after the window, we can calculate the error and percentage error of each forecast, and use boxplots to show their range (above). Most forecasts underestimated the CI on this day.
For the latest results, see the repo on Github.
Does this matter?
If the forecast error is enough to cross a boundary between “green” and “not green” electricity, then maybe this matters.
If a forecast checked at any given time is unlikely to have such an extreme error, however, then we can confidently rely upon it.
Let’s define a problematic forecast as any which erroneously tells us the CI will be “low” for a given window (up to 48 hours in the future), but that window actually records a CI of “high” or above. In 2023, that means a CI difference of at least $200-119=81\ gCO_2/kWh$, or an error of 40.5%. Similarly, you would need an error of about 92 $gCO_2/kWh$ to cross from “moderate” to “very high”, or 81 $gCO_2/kWh$ to cross from “very low” to “moderate”.
How likely are such errors? They seem safely above the mean absolute error quoted above (13.7 $gCO_2/kWh$), but that was calculated from the final forecasts, and doesn’t include the forecasts made for 48 hours prior to each window.
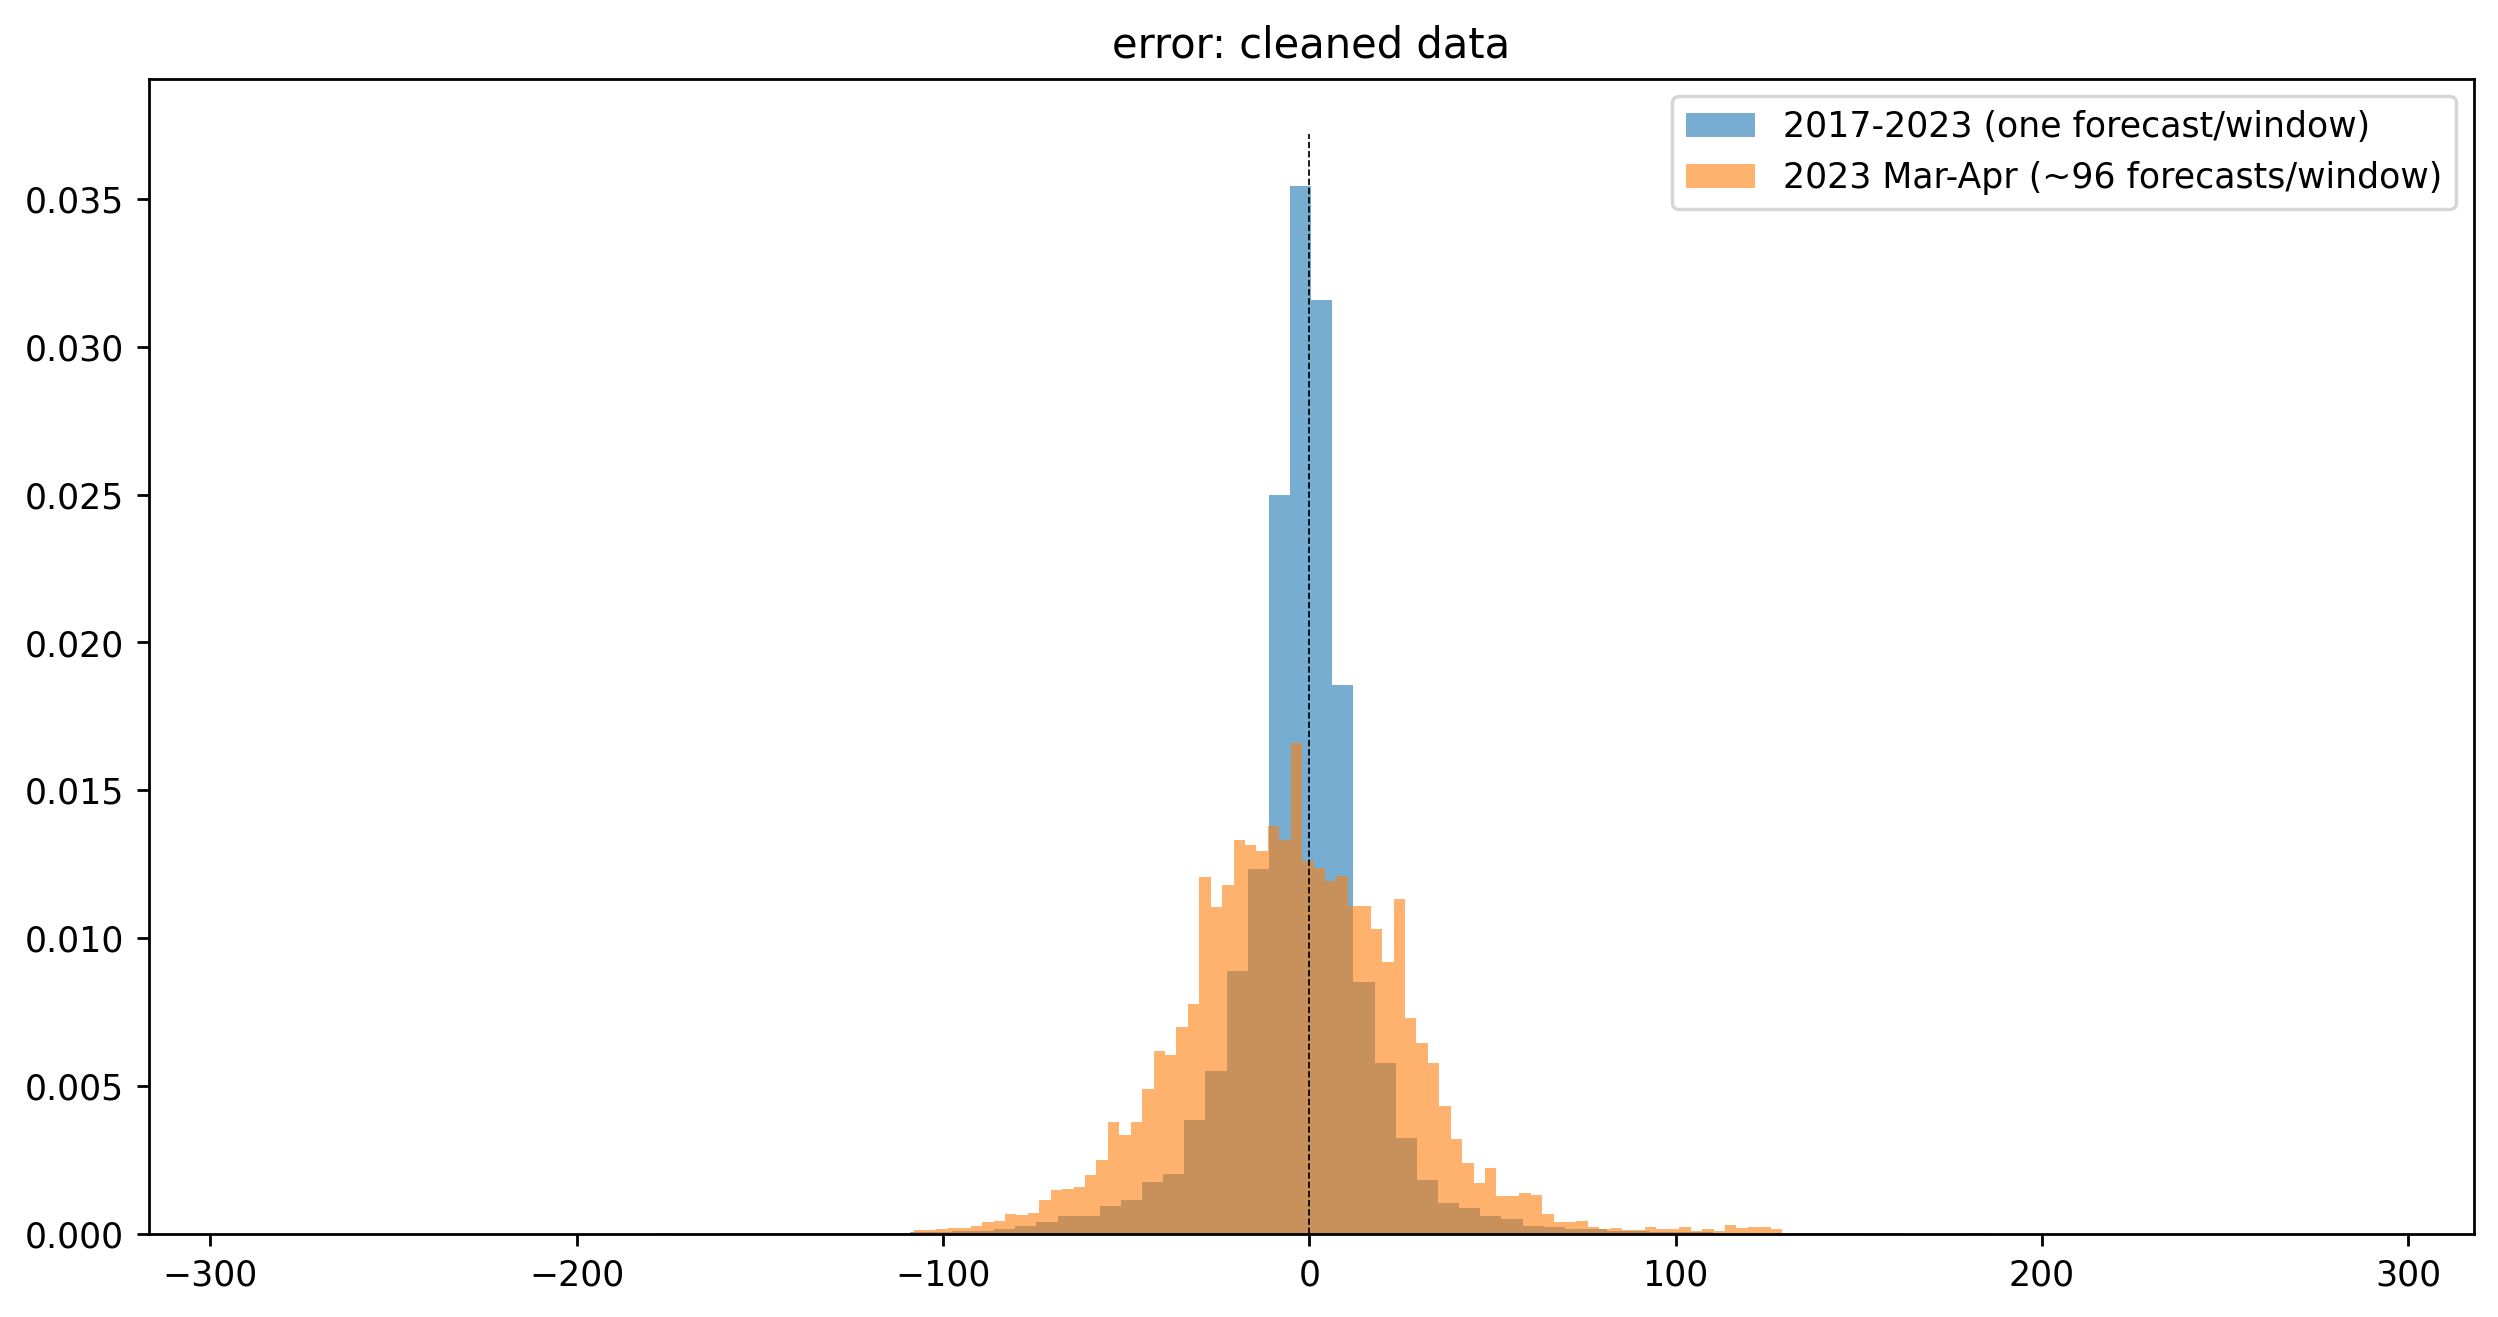
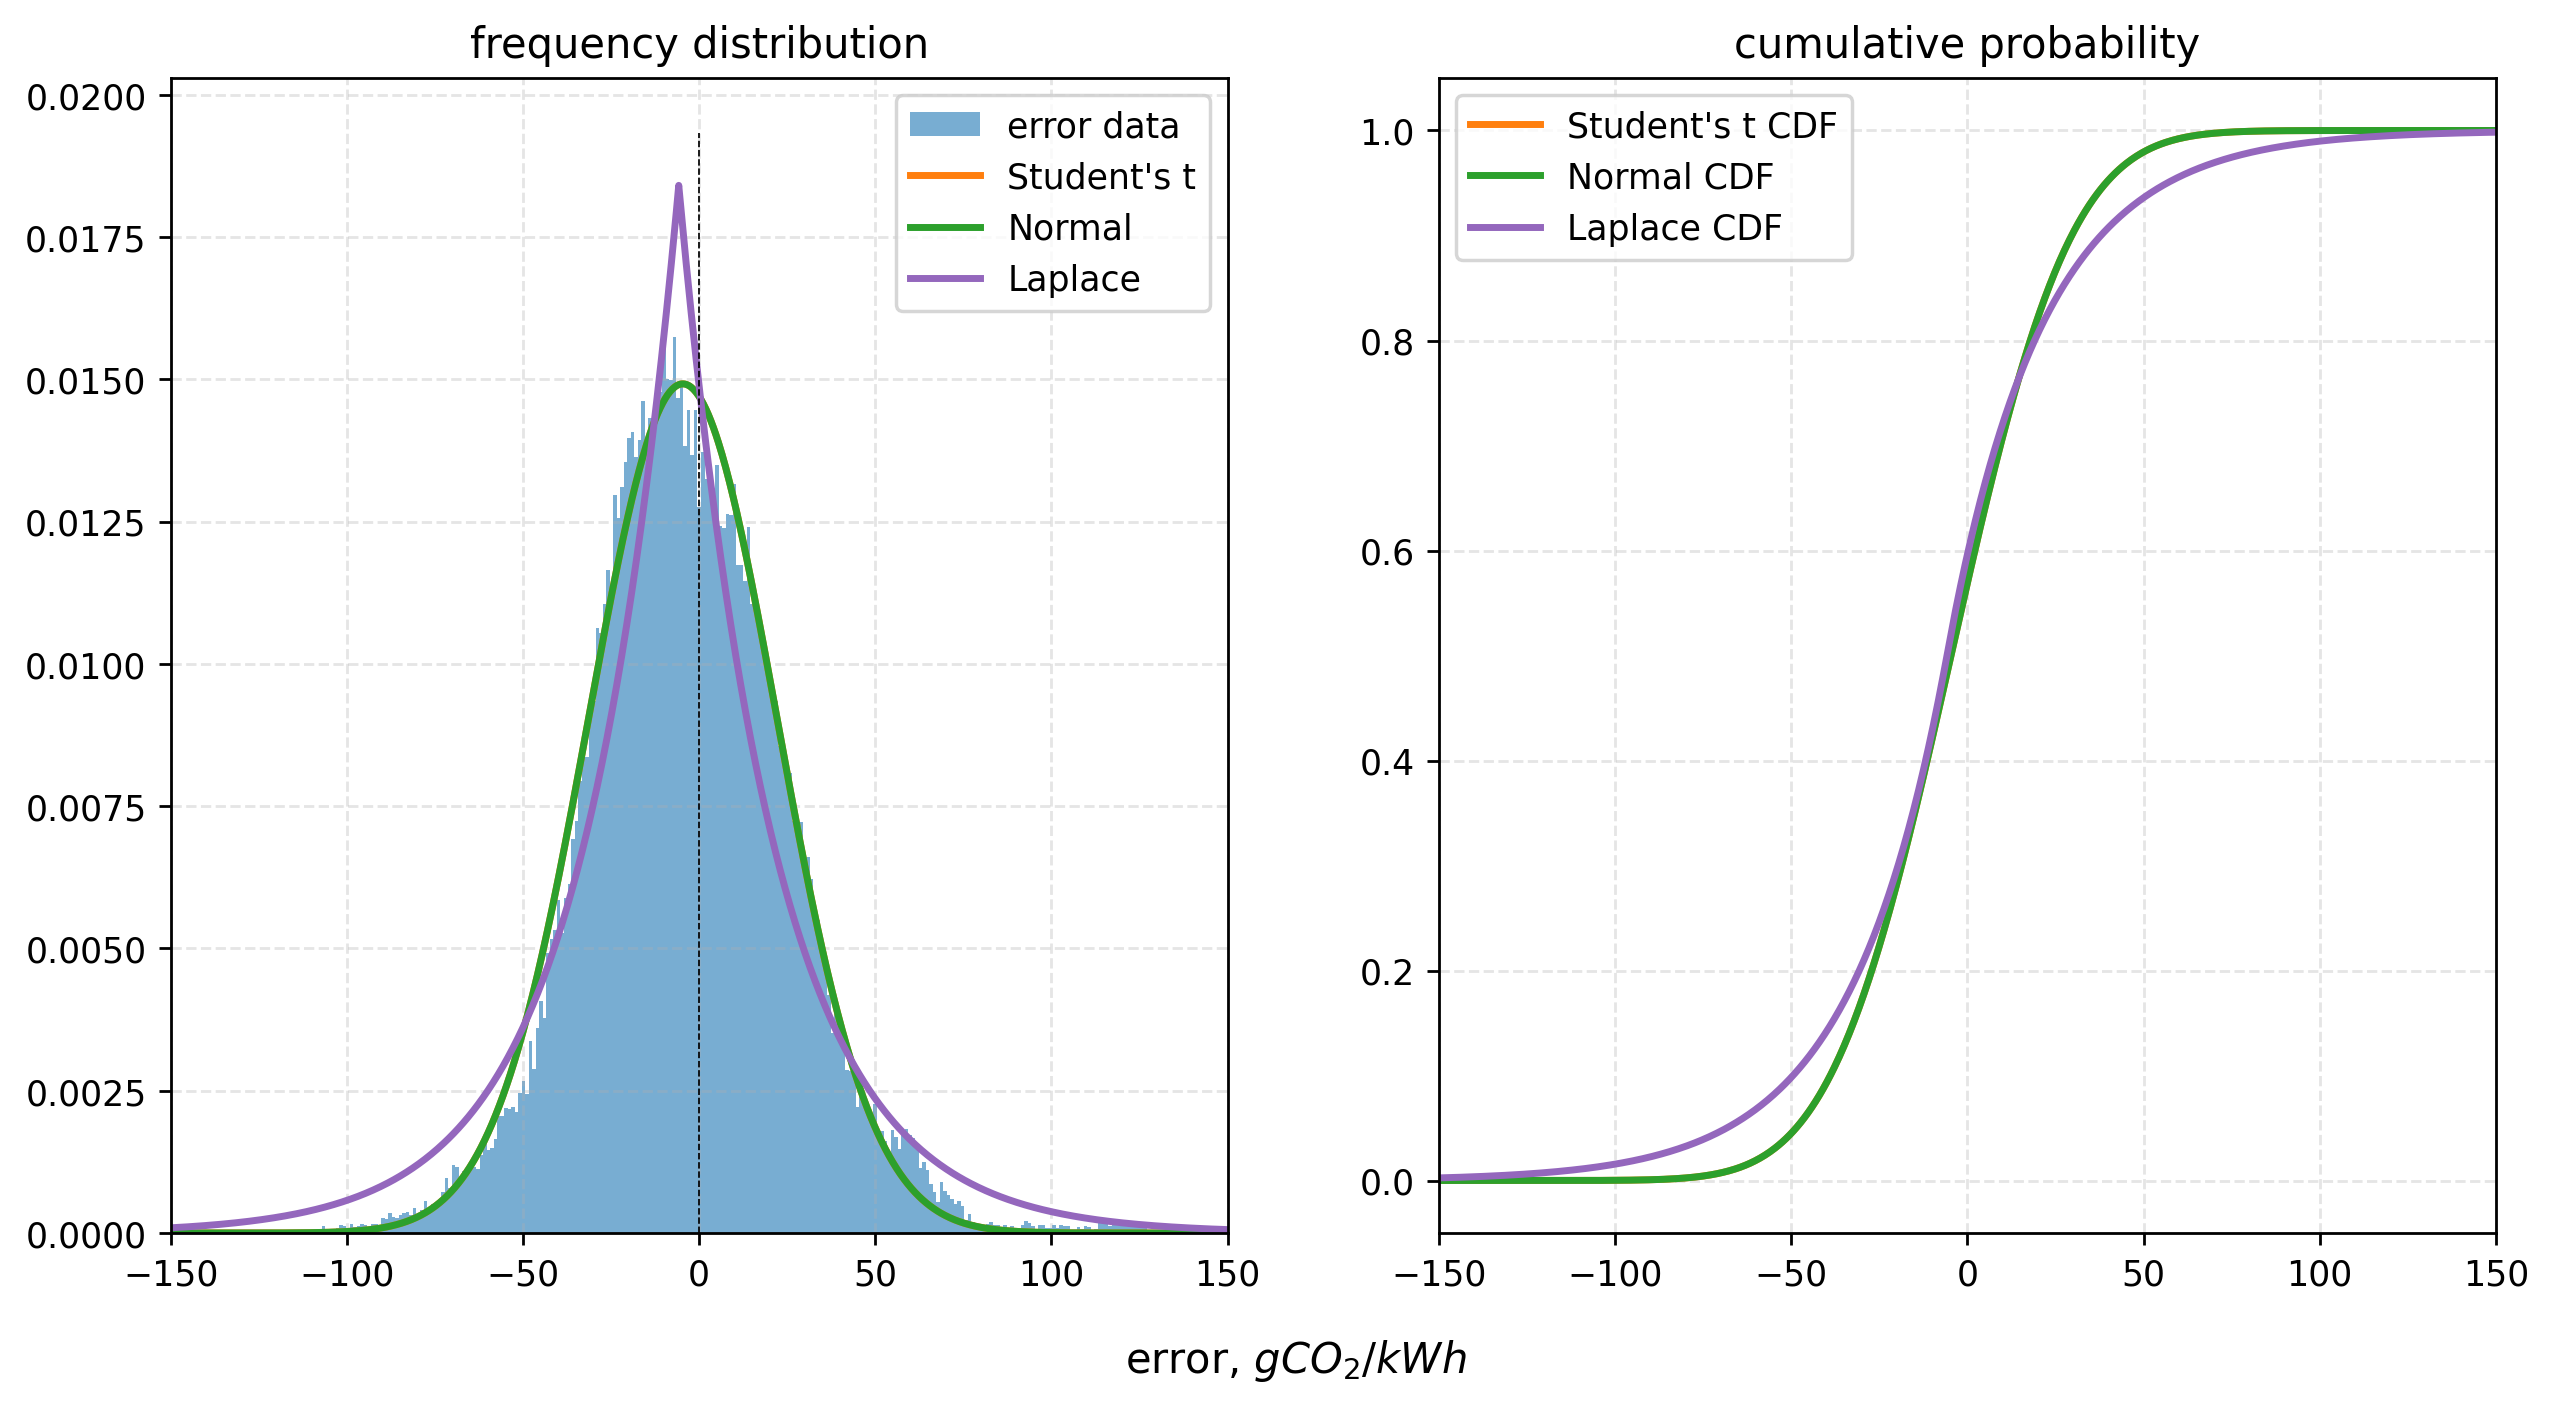
A Laplacian distribution fits the historical forecast error data (one forecast per half-hour window) quite well (see investigation notebook). With about two month’s complete forecast data2 from March-May 2023, however, including all 96 forecasts for each window, the fit appears closer to the Normal. Individual forecasts have a broader error range, and the distribution is slightly asymmetric. Forecasts in the times sampled tended to underestimate the true CI, but without as many extremes; those are mostly positive (some have over 150% error). The mean absolute error – as of this writing – is 22.8 $gCO_2/kWh$ (the median is 19.0 $gCO_2/kWh$).
So, how likely are you to see such errors? Assuming either of the two distributions above hold (Student’s t closely approximates the Normal), here are the current probabilities of different forecast errors3:
| index range | CI change, $gCO_2/kWh$ | % error | chance (Normal) | chance (Laplacian) |
|---|---|---|---|---|
| very low - moderate (or greater) | 81 | 67.5% | 0.28% | 5.2% |
| low - high (or greater) | 81 | 40.5% | 0.28% | 5.2% |
| moderate - very high (or greater) | 92 | 31.6% | 0.07% | 3.5% |
Conclusion
If we assume forecast error is both normally distributed and independent of the actual CI4, then less than 1 in 300 forecasts have significant, “problematic” error. There are 96 forecasts per half-hour window, so such errors might occur once every 2 hours (4 windows), or approximately 12 times per day.
This is fairly good! It’s unlikely that you’ll see a forecast which is so wrong that it should change your decision to use electricity. In most cases, the NGESO’s forecasts are reliable.
Of course, those are large errors. If you were only willing to accept smaller errors – from the middle of one band to the next-highest, for example, or 40 $gCO_2/kWh$ – then the probabilities are higher (about 14%). You might expect to see such an error 645 times per day.
As noted above, the index bands’ ranges narrow every year, to 2030, when the “very high” band will begin at 150 $gCO_2/kWh$, around half its 2023 value, in line with a national target of 100 $gCO_2/kWh$.
Unfortunately, the forecast will become increasingly unreliable, in terms of CI index, if the current error rate remains the same. In 2027, an error of 52 $gCO_2/kWh$ will be enough to mistake “very high” for “moderate” CI (probability 5.5%). In 2030, that figure will be 22 $gCO_2/kWh$ (probability 41.7%) – just below the contemporary mean.
We should hope that the forecasts can be improved!
This dataset, being from only about two months’ data, is quite limited. It will be updated (continuously!) in the Github repo, where the latest plots are also available.
If you find problems with this analysis, or have any comments, please do let me know!
-
The “actual” values are still approximations, and are somewhat incomplete owing to the omission of some smaller generation sources, but they give a reasonable estimate for these purposes. ↩︎
-
168111 data points. ↩︎
-
We could ignore positive errors, which overestimate the CI. But you might be just as likely to make a decision not to use electricity (which you were going to use anyway) when you really could have. So these are the total probabilities, using both sides of the distribution. ↩︎
-
Some assumptions made for these distributions are likely wrong. Sequential forecasts are likely not independent; National Grid’s models are probably weighted by previous forecasts. Nonetheless, the error magnitudes are roughly independent of the final “actual” CI value ($r\approx-0.149$). ↩︎
